Center of Pressure Detection
September 1, 2015
Overview
The goal of this project is create a prototype for a device that is portable and can measure the center of pressure of each foot throughout the gait cycle. Center of pressure (CoP) tells you where the ground reaction force vector is applied; the center of pressure is especially important for biomechanical applications because it can provide important information about posture and gait. CoP changes throughout the gait cycle, starting off at the heel during heel strike moving along the foot and ending at the toes during toe-off.
Contemporary methods for measuring the center of pressure are very expensive, bulky, and not robust and the goal of this project is to develop a device that solves those problems. The current prototype was developed by extracting sensors from an old bathroom scale, designing a circuit that would amplify the signal while protecting from environmental noise, center of pressure calculations, and a way to visualize this data for further analysis using serial communication between Matlab and the PIC32.
Click on the picture below for a short demonstration video! In this video, you can see me first run the Matlab script that initiates serial communication with the PIC32, select the case (‘c’) that will plot the (X,Y) coordinates from COP that it receives from the PIC on a rectangle that is scaled to represent the foot plate prototype.
Project requirements:
Before I began designing, I needed to establish a list of requirements that this prototype should fulfill. The device must be:
-
Durable:
It should withstand a minimum about 6 months of every day use or be cheap and easy enough to replace over a smaller timespan.
-
Accurate:
Following the standards for accuracy of weight scales, the device should be accurate to 1% of the full scale reading; linearity, repeatability, and uncertainty of the sensor measurement all contribute to how accurate the device is.
-
Lightweight:
It should not add so much weight that it changes the user’s gait and it should also be comfortable to use.
-
Low-cost:
Current CoP measurement devices are oftentimes upwards of $15,000 range. Ultimately, we would like the device to be a tenth of that cost or less.
Major steps involved:
-
Research potential options for force sensors:
-
Force Sensitive Resistor (FSR):
There are some potential issues with the FSRs for this particular use case. A force sensitive resistor, as the name indicates, changes resistance proportional to the amount of force applied. However, these sensors are not very robust and are good at telling that a force is applied at a location, but not really at discriminating between what amount of force is applied there.
-
Piezoelectric Force and Strain Sensor:
This sensor is not a long term solution because the signal generated by the quartz core decays over time.
-
Conductive Fabric:
I knew it was a long shot, but I was still curious as to how linear this sensor would perform in terms of whether its resistance would change linearly in response to a force input; testing indicated the input/output relationship was far from linear; though there are ways to deal with non-linear sensor signals, this is one use case in which sensor linearity is a very important factor.
-
Strain Gauge:
This was by far the only sensor that was robust, cheap, and extremely linear. For the first stage prototype, this was a good way to move forward.
-
-
Take apart a bathroom scale:
I started off with an older model of the Health-O-Meter digital scale and took it apart to get 4 strain gauges out of it.

-
Built test prototype:
To start off, I made a simple test prototype so I could put more time towards getting the sensors that I extracted from the bathroom scale working with my own circuitry. Thus, I placed the strain gauges at four corners of a rectangular 7”x10” plate, and then placed a similar rectangular piece on top.
Wires were connected to a small board, which had a ribbon cable connector. The ribbon cable led out of the prototype and attached directly to the breadboard that contained the PIC32.
-
Design external circuitry for newly obtained sensors:

Above is the circuit diagram for the external circuitry used to receive, amplify, and filter signals from the strain gauge and send those enhanced signals to the PIC32 ADC. There is one of these circuits for each of the strain gauges. Below, I’ll go through each of the components in more detail:
-
Operational Amplifier (LM358):
The output from the strain gauges provide the non-inverting input for the op-amp; the inverting input and output of the op-amp are then connected to complete a buffer circuit with unity gain such that the signal did not change, but will be a good low impedance input to the instrumentation amplifier.
-
Instrumentation Amplifier (AD623AN):
The strain gauge output signal sits at a voltage of about half the voltage powering the circuit. However, the change in the signal when force is applied is barely detectable without any amplification. The instrumentation amplifier is therefore extremely important in the amplification of the signal so changes are easier to detect.
However, the gain of the circuit must be chosen carefully in that too much amplification can lead to more noise in the circuit simply due to the amplification of it. Initially, I tried a gain of 1000, but that was outside of the recommended range for this particular chip and also amplified the noise in the signal significantly. I chose a gain of 400, which ended up working well.
-
Low-Pass Filter:
I used the nScope as a DAQ so I could collect data from the sensors and then do some digital signal processing in Matlab. In particular, I tried to determine what frequency the noise was at and build low pass and bandpass filters in MATLAB to look at the data before and after the signal processing.
In the end, I came to the conclusion that a good cutoff frequency is about 30 Hz and used a 10 kOhm resistor and a 0.47 uF capacitor to achieve that cutoff frequency.

-
Analog-to-Digital Converter (ADC):
The ADC on the PIC32 has 10 bits of resolution, which means that 3.3/2^{10} ≈ 3.2 mV per bit. There are two options for usng this data after the ADC converts the voltage values it reads into bits: either convert the values back into voltage or use the bit values to calibrate. Since I calibrated my strain gauges by collecting data with the nScope again and processing that data in MATLAB, I needed to convert back into voltage so I could use the appropriate calibration equations.

-
-
Calculate the Center of Pressure:
After the voltage values are obtained from each of the strain gauges and converted to corresponding weights, I used the calculations below to calculate the x and y coordinate values for CoP. I tried this prototype with 3 sensors (arranged in an isosceles triangle) and 4 sensors, with 4 giving better results.
x = xmax*((F2+F3)/FL)
y = ymax*((F4+F3)/FL)
FL = F1+F2+F3+F4
-
Improve upon prototype:
-
Physical Device:
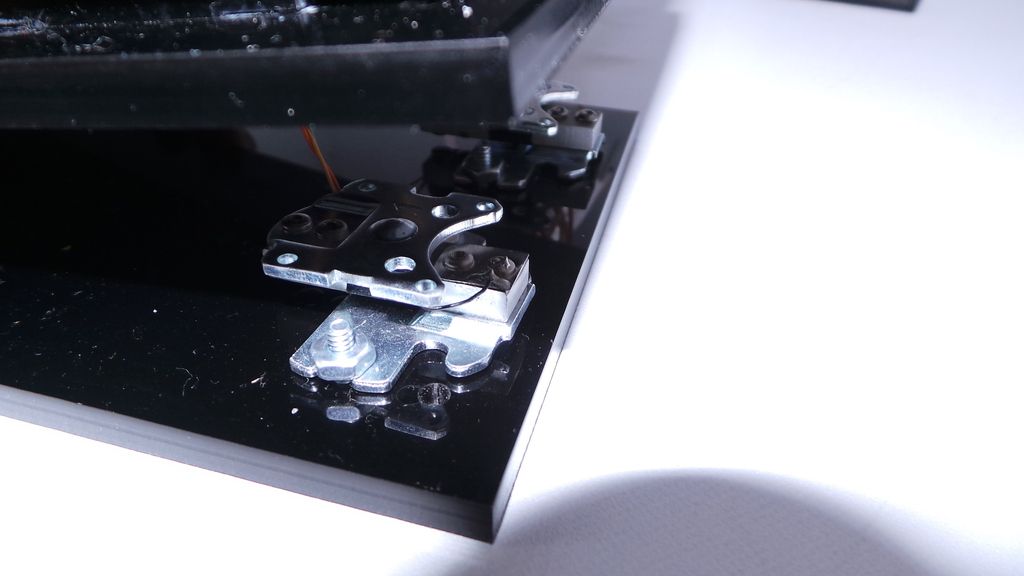
Through using the initial prototype, I learned a lot about improvements that needed to be made. First of all, I needed to keep my external circuitry as close to the strain gauges as possible so as to shorten wire length and eliminate opportunities for noise. To solve this problem, I soldered four independent circuits (a sample shown below) and placed them in their own compartment on the prototype.
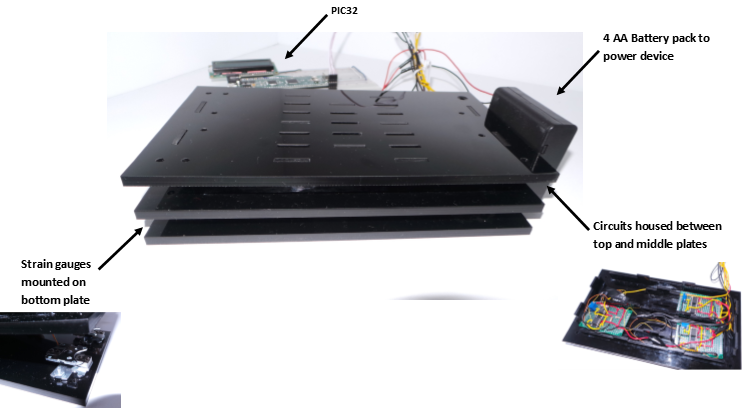
Next, when a force was applied to the top plate of the initial prototype, the top plate flexed, indicating that the strain gauges were not reading all of the force that was applied. To fix this, I put thin beams along one of the plates (with space for the circuits), and a matching plate on top. This now serves as a compartment for the electronics as well as a more stiff top plate for the device. The compartment sits on top of the strain gauges, that are mounted to a lower plate in the same way as described before.
I made this new design in wood once again and, once I verified that it worked significantly better than the initial prototype, I laser cut the final prototype using acrylic. I used 0.25” thick acrylic for the plates and 0.125” acrylic for the beams.
-
Coding Updates:
I updated the code to send an (x,y) coordinate from the PIC to Matlab each time is was prompted to do so by Matlab (every half second). This code was then use to plot in real-time x or y values vs. time and then a visual plot of where the COP was on the plate (an image of a plate) so you can see where you pressed during collection. This is reflected in the video!
-

Conclusions:
This device has room for improvement, but it performs well at locating the center of pressure. I was not able to get it down to a smaller form factor in the timeframe, but that is something that I would like to continue developing on my own. Overall, the project was an incredible learning experience- thanks so much to Professor Peshkin, Nick Marchuk, and Jarvis Schultz for their continuous advice!!!